Local heat mapping
Our city is getting hotter. Urban areas with lots of hard surfaces like concrete and roads tend to store and radiate heat, especially where there is little vegetation. This build-up of heat is known as the urban heat island effect.
On top of the urban heat island effect, extreme heat events – heatwaves – are increasing as a result of climate change. The combination of these two things can create very high temperatures. Therefore, addressing the risk of heatwaves and the urban heat island effect is of a high priority. Urban heat can be reduced by planting trees with large canopies and installing green infrastructure, including rain gardens, bio-swales, and green roofs and walls.
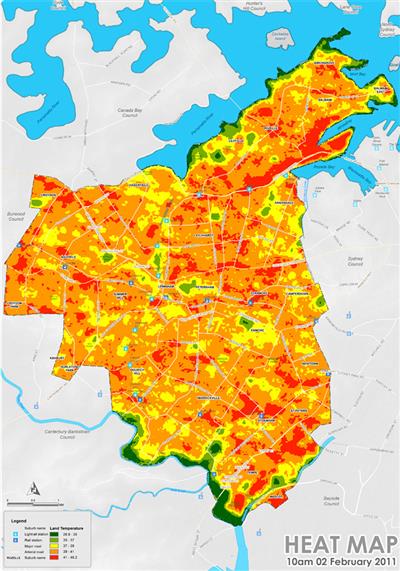
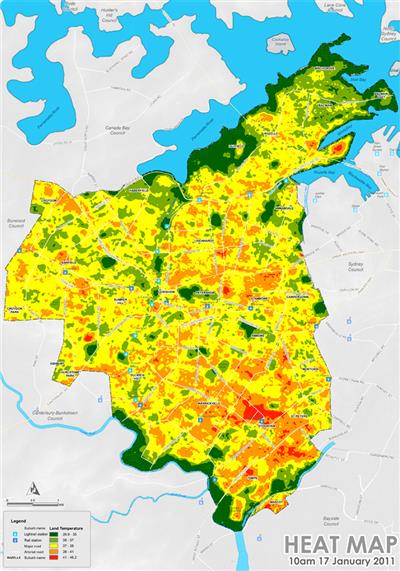
These urban heat maps below show land temperatures on 2 February 2011, a heatwave day, and 17 January 2011, a normal summer day. This data was provided by CSIRO and Geosciences Australia.
Another factor to consider is that some people are more affected by the heat. The heat vulnerability map below shows populations more vulnerable to extreme heat, such as the elderly.
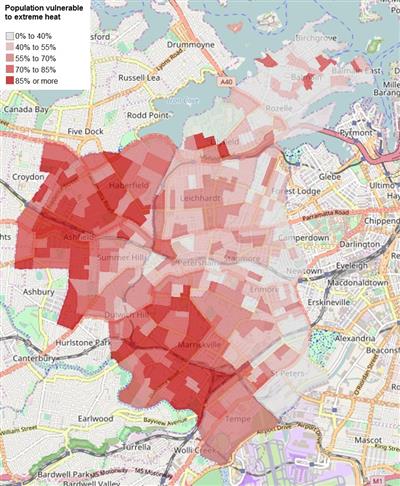
The urban heat maps and the heat vulnerability maps can be combined to highlight some of the high priority areas for planting more trees and introducing green infrastructure.